The ONS (Office for National Statistics) have just released their April HPI (House Price Index)
Main findings
- UK house prices increased by 5.5% in the year to April 2015, down from 9.6% in the year to March 2015.
- House price annual inflation was 5.8% in England, 1.3% in Wales, 2.2% in Scotland and 8.8% in Northern Ireland.
- The pace of annual house price growth fell across the majority of the UK in April 2015.
- Annual house price increases in England were driven by an annual increase in the East (9.6%) and the South East (8.4%).
- Excluding London and the South East, UK house prices increased by 5.0% in the 12 months to April 2015.
- On a seasonally adjusted basis, average house prices fell by 1.3% between March and April 2015.
- In April 2015, prices paid by first-time buyers were 5.8% higher on average than in April 2014. For owner-occupiers (existing owners), prices increased by 5.4% for the same period.
House price index UK summary
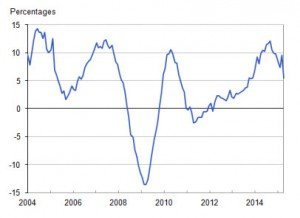
UK average house prices increased by 5.5% over the year to April 2015, down from an increase of 9.6% in the year to March 2015 (Figure 1). The average UK mix-adjusted house price in April 2015 was £271,000.
Figure 1: Annual house price rates of change, UK all dwellings from January 2004 to April 2015 12 month percentage change
House price index by country
During the year to April 2015, average house prices increased 5.8% in England (down from 9.4 in the year to March 2015), 1.3% in Wales (down from 5.7%), 2.2% in Scotland (down from 14.6%) and 8.8% in Northern Ireland (up from 7.5%). The slowing of the annual growth in Scotland between March and April (Figure 3) is likely to be caused by the introduction of the land and buildings transaction tax, which replaced UK stamp duty land tax in Scotland from 1 April 2015.
The impending introduction of this tax saw a significant increase in the number of mortgages for house sales in Scotland between February and March 2015, a significant proportion of which was for houses costing more than £500,000 and ultimately contributed to the high annual growth witnessed last month (14.6%). This month has seen the pattern of mortgage sales in Scotland return to levels in line with longer-term trends.
House price index by region
The pace of annual house price growth slowed across the majority of the 9 English regions in April 2015. The largest annual increase was in the East at 9.6% (down from 11.4% in the year to March 2015) followed by the South East (8.4% increase in the year to April 2015, down from 11.2%). The lowest growth in April 2015 was in the North East; here prices increased by 1.2% over the year. London prices increased by 4.3% over the year to April 2015 (down from 11.2% in the year to March 2015). This is the lowest annual rate of growth for London since October 2012. Excluding London and the South East, UK house prices increased by 5.0% over the year to April 2015, down from 8.1% in the year to March 2015
Economic context – April 2015
The UK housing market showed signs of easing in April 2015, with prices increasing by 5.5% over the previous twelve months. This is a 4.1 percentage point monthly fall in the annual rate of inflation, the largest since April 2005. One of the largest drivers of this fall was the sharp weakening in London annual house price growth, where house prices grew at a slower annual rate than the UK average for the first time since February 2006. April’s figures are a continuation of the softening of the housing market that has been evident since the third quarter of 2014.
Since September 2014, the rate of annual house price inflation has been declining gently, subsiding from 12.1% to 5.5% in the latest data. This easing is reflected in a number of indicators of the housing market, which suggest demand and supply are now more balanced than in recent months. A number of indicators published by the Bank of England have noted subdued demand for mortgages, a leading indicator of housing purchases, suggesting buyers are becoming more circumspect about taking on large mortgages.
Together with the introduction of more stringent borrowing criteria in last April’s Mortgage Market Review, mortgage approvals in the three months to April 2015 was 4.3% lower than in the same three months a year ago. This lower demand for mortgages is reflected in transaction levels, with HMRC’s statistics showing that the number of homes bought in April 2015 was 5.6% down on last year.
While housing demand appears to have eased, several indicators suggest supply has increased but nonetheless remains tight. The ONS’ Output in the Construction Industry release shows that private new housing work rose by 16.6% in the year to April, possibly indicating some growth in the supply of new homes. Data from the Department for Communities and Local Government also shows that in the first quarter of 2015, housing completions were 21% above their level a year ago, albeit well below their pre-downturn peak.
Broader economic indicators suggest that the economy continued to grow relatively strongly during the first quarter of 2015, which may in turn feed into consumer expectations of the housing market. Labour market conditions have continued to improve, as unemployment fell to 5.5% in the three months to March 2015. Recent weakness in inflationary pressure and a return of nominal earnings growth have also improved the economic position of households, with possible implications for the evolution of house prices.
- Is It Bad To Buy a Flat Instead of Renting? - May 9, 2023
- Is It Bad To Buy a Flat Instead of Renting? - February 20, 2023
- If You Buy a UK House at Auction, When Do You Pay? - February 15, 2023


