The Land Registry is reported later than most HPI stats, but claims to be the most accurate as it is based on completed sales, and included repeat sales. HPI increased by 0.1% in November compared to October figures. The average house price set at £165,411
The Land Registry is reported later than most HPI stats, but claims to be the most accurate as it is based on completed sales, and included repeat sales.
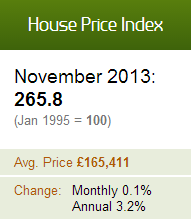
Key Figures:
- HPI increased by 0.1% in November compared to October figures
- Over the year from November 2012, the increase seen was 3.2%
- The average house price set at £165,411
- Increased number of property transactions over the last year, with an average of 70,021 sales per month, compared to 59,228 a year before.
Regional breakdown
London only just continued to be the highest performing region over the month, with an increase of 1.8%. However the North West was very close with an increase of 1.5%.
The South West, East Midlands and East all saw negative changes in price over the month, with -0.1, -0.1 and -0.7 respectively.
Over the year however all regions apart from the North East saw increase. London far outstripped the rest of England and Wales with a 10.6% increase. The next closest was the South East with 3.5%. At the bottom of the charts was North East with a -1.6% fall, followed by 0.8% in the North West.
Property Type Breakdown
Over the year:
- Detached properties saw an increase of 3.0% for an average house price off £260,460
- Semi-Detached properties saw an increase of 2.5% for an average house price off £156,335
- Terraced properties saw an increase of 3.9% for an average house price off £125,729
- Flat/maisonette properties saw an increase of 3.4% for an average house price off £165,411